Upload your data. Get your answers.


Feature 01
Instant Data Upload & Auto-Clean
“Upload once, trust it immediately.”
Founders don't have time to prep spreadsheets. This feature automatically detects and fixes common data problems — missing values, duplicate rows, inconsistent formatting — the moment a file is uploaded. No technical knowledge needed. The data is ready to use in seconds.

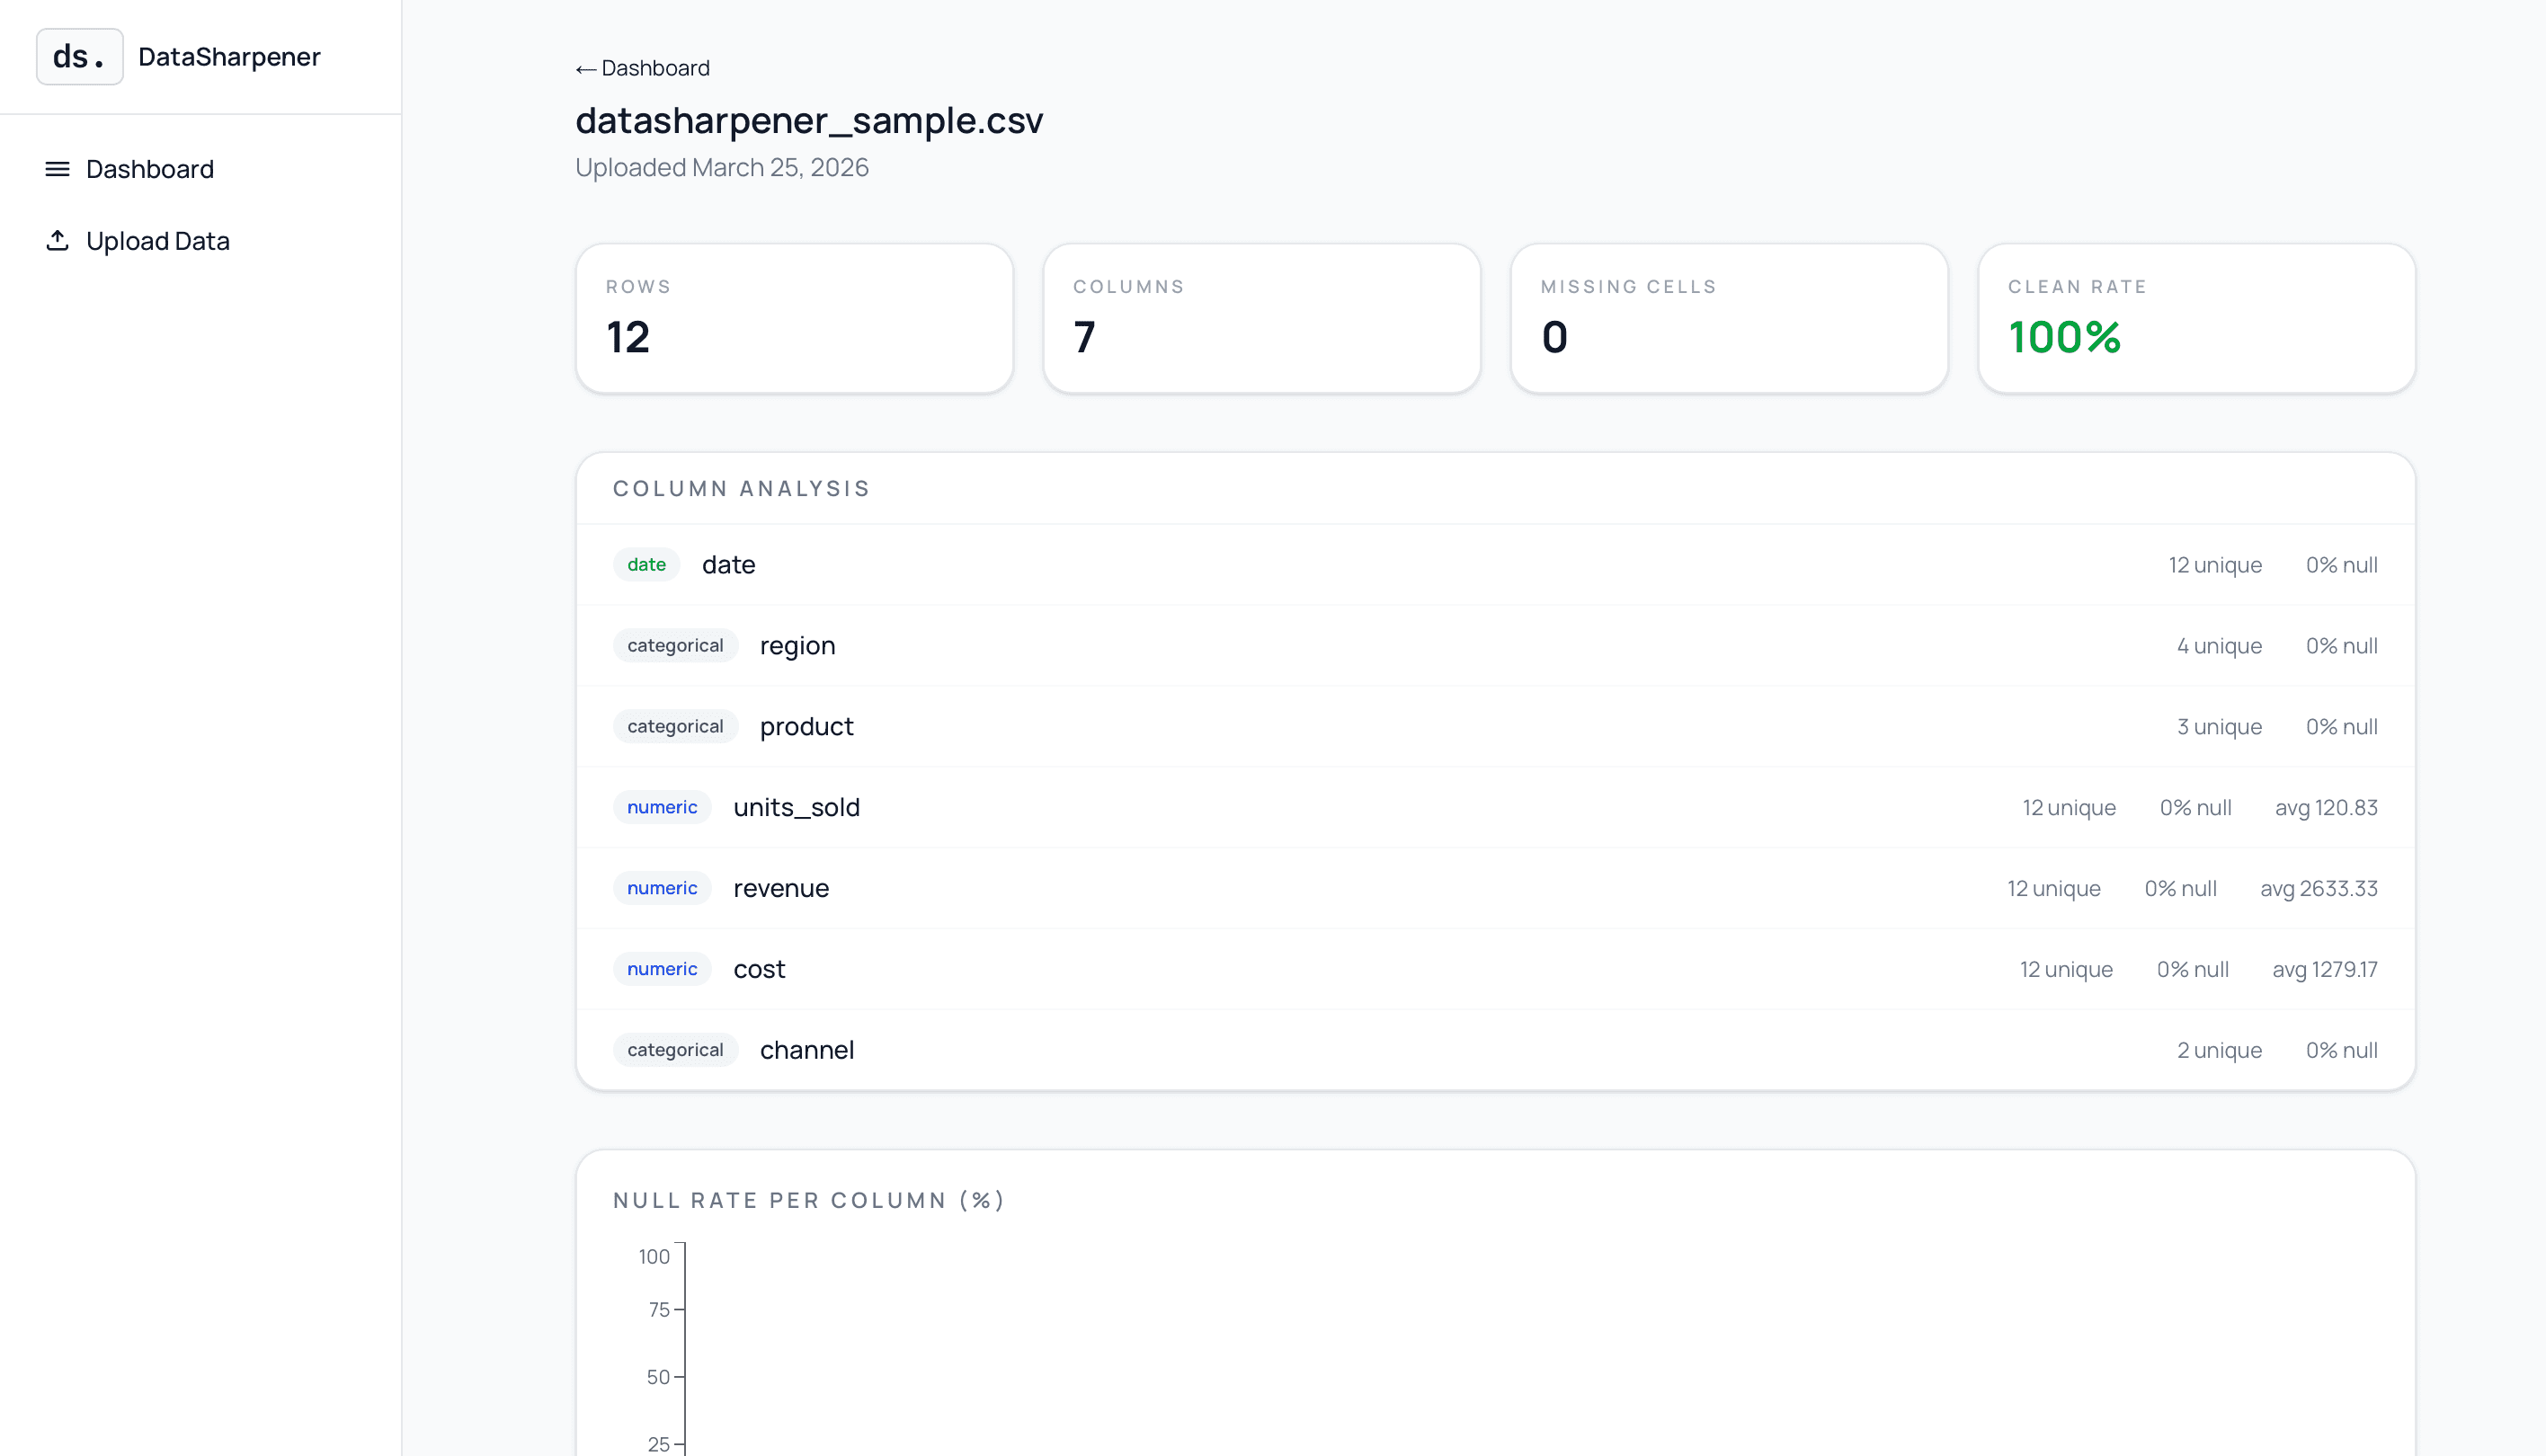
Feature 02
Auto-Generated Smart Dashboard
“Your data tells its own story.”
Once uploaded, DataSharpener automatically generates the most relevant charts and KPIs based on what's in the data — trends, comparisons, distributions. No manual chart-building required.

Feature 03
Problem Detector & Early Warning Flags
“Know what's wrong before it costs you.”
This feature scans the data for anomalies, drops, spikes, or patterns that signal a problem — a sudden drop in sales, a spike in churn, a channel going quiet. It flags issues in plain English, not data-speak.
Who it's for
Built for people, not data teams
You don't need to know SQL, Python, or Tableau. You just need a CSV and a question.
Small business owners
No budget for a data team. You just need to know what's working and what isn't — fast.
Team leads & managers
Need to present data to your team. Done without spending days in Excel building charts.
People who don't know where to start
You have data, you know it matters, but you don't know what to do with it. Start here.
Anyone who needs quick results
Drop in your file. Get something real within minutes, not weeks.
What problems it solves
Before DataSharpener. After DataSharpener.
Before
After
Starting at rows of numbers with no idea where to look
An instant summary tells you exactly what matters
Not realising half your data is incomplete or broken
Data health score flags every gap and problem automatically
Spending hours building charts in Excel or Google Sheets
Contextual charts generated automatically on upload
Having to ask a developer or analyst for every question
Ask a question in plain English, get your answer instantly
Preparing a presentation from scratch takes a full day
Download a complete report — ready to share
What you get
Everything in one upload
No setup. No integrations. No learning curve. Upload your file — everything below is generated instantly.
Data health score
Missing values, duplicates, inconsistencies — surfaced automatically, before they cause problems.
Auto-generated charts
Bar charts, pie charts, trend lines — picked based on your data's context, not a template.
Plain-English summary
No jargon. A clear, readable explanation of what your data is actually saying.
Ask the data anything
Type a question like "which product sold best in Q3" and get a direct, data-backed answer.
Custom chart builder
Choose your own chart type, colour palettes, and fonts to match your brand or style.
Downloadable full report
Export everything — summary, charts, health data, hints — into one clean report ready to present.
ROI
Know Where Your Money Is Actually Working
Most small business owners know ROI matters, but the real picture stays blurry. DataSharpener makes it visible, instantly.
- See which channels, products, and activities are generating real returns — and which ones are draining your budget.
- Upload your data and get an instant breakdown of what's working, with no analysts or complex setup needed.
- Stop making gut-feel decisions — replace them with a clear, data-backed view of where to invest next.
- Identify underperforming areas early, before they quietly eat into your growth.
Gross Margin
Spot the Problem Before It Scales
Revenue looks great on paper — until you see what it cost to make it. DataSharpener surfaces your gross margin automatically.
- See your margin broken down by product, channel, or time period — not just as a single blurry number.
- Identify which products or services are actually profitable and which ones have dangerously thin margins.
- Catch margin problems early, before they turn into a cash flow crisis at scale.
- Stop checking margin only at tax time — track it continuously so you can act when it matters.
What's new
Latest updates across the site
Fresh articles so you can see the work, the approach, and the results.

Insights
New article: Why Your Dashboard Is Lying to You
Dashboards can be confidently, consistently wrong without throwing an error — and how to fix that.
Read the article
Insights
New article: Attribution, MMM, and Lift Analysis
When to use each measurement model and why the wrong choice can be worse than no model at all.
Read the articleGet started
Your data, finally working for you
Built for the moment before you know what to do. Upload, explore, understand — then share what you found.
Contact
Ready to make decisions with clarity?
Book a quick demo and we'll map your data, dashboards, and quick wins.
Prefer email? hello@datasharpener.com