Case Study
S&P 500 Portfolio Analysis
Python-driven analysis of historical S&P 500 stocks (AAPL, MSFT, NVDA, CHK) covering cumulative returns, moving averages, volatility, correlations, and diversified portfolio performance.
Summary
What we found
NVDA delivered the strongest long-term cumulative return, driven by GPUs, AI, and data centers.
CHK was the most volatile but did not translate that risk into higher returns.
AAPL and MSFT provided steady, moderate-risk growth and anchor the portfolio.
Diversification plus lower correlations (NVDA vs. AAPL/MSFT) reduced total portfolio volatility.
Details
How the analysis was structured
Introduction
- Complete, end-to-end analysis of historical S&P 500 stock data using Python, Pandas, and Matplotlib.
- Goal: explore financial time series, evaluate individual stock performance (AAPL, MSFT, NVDA, CHK), and build a diversified portfolio.
- Process: data cleaning and transformation, daily returns, cumulative curves, moving averages, volatility indicators, correlation matrix, and portfolio aggregation.
Key Insights
- NVDA emerged as the strongest long-term performer with exponential growth.
- CHK showed the highest volatility yet weak long-term performance—risk did not equal reward.
- AAPL and MSFT delivered stable, consistent returns with moderate risk—ideal anchors for diversification.
- Combining high-growth (NVDA) with steady anchors (AAPL, MSFT) improved return while lowering overall volatility.
Highlights by View
- NVDA vs CHK Cumulative Returns: NVDA’s momentum outpaced CHK’s volatile but flat performance.
- Single-Stock Comparison (AAPL, MSFT, NVDA): NVDA led, especially post-2016; AAPL/MSFT stayed steady.
- Portfolio Performance Over Time: upward trajectory with diversification smoothing drawdowns.
- Moving Averages (SMA20/50/200): trend-following view showing sustained bullish momentum and momentum shifts.
- Distribution of Daily Returns: mostly centered near zero with normal-ish shape and occasional tails.
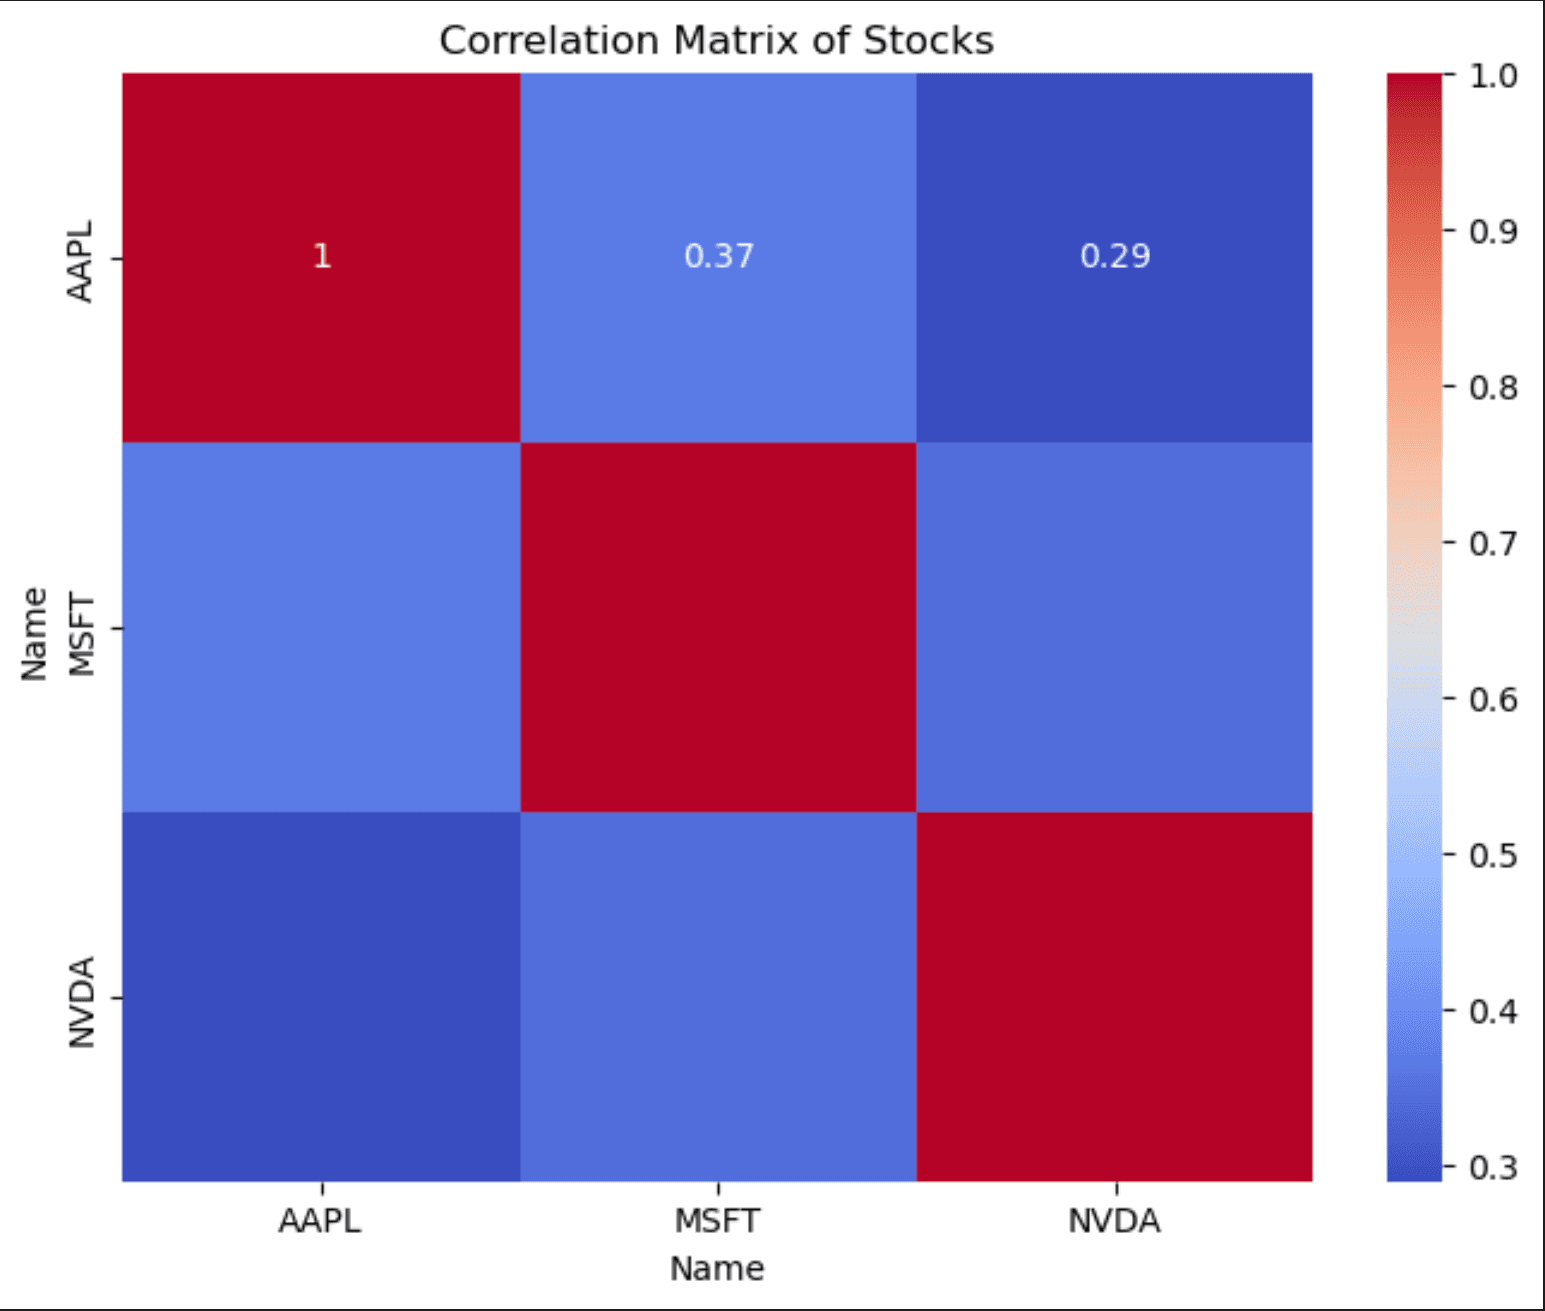
- Correlation Matrix: NVDA’s lower correlation with AAPL/MSFT enhanced diversification benefits.
What This Demonstrates
- Diversification works when assets are not perfectly correlated.
- High-quality growth names can lift portfolio returns while anchors manage risk.
- Pairing return analysis with volatility, correlations, and moving averages gives a fuller risk/return picture.
Visuals
Charts from the analysis
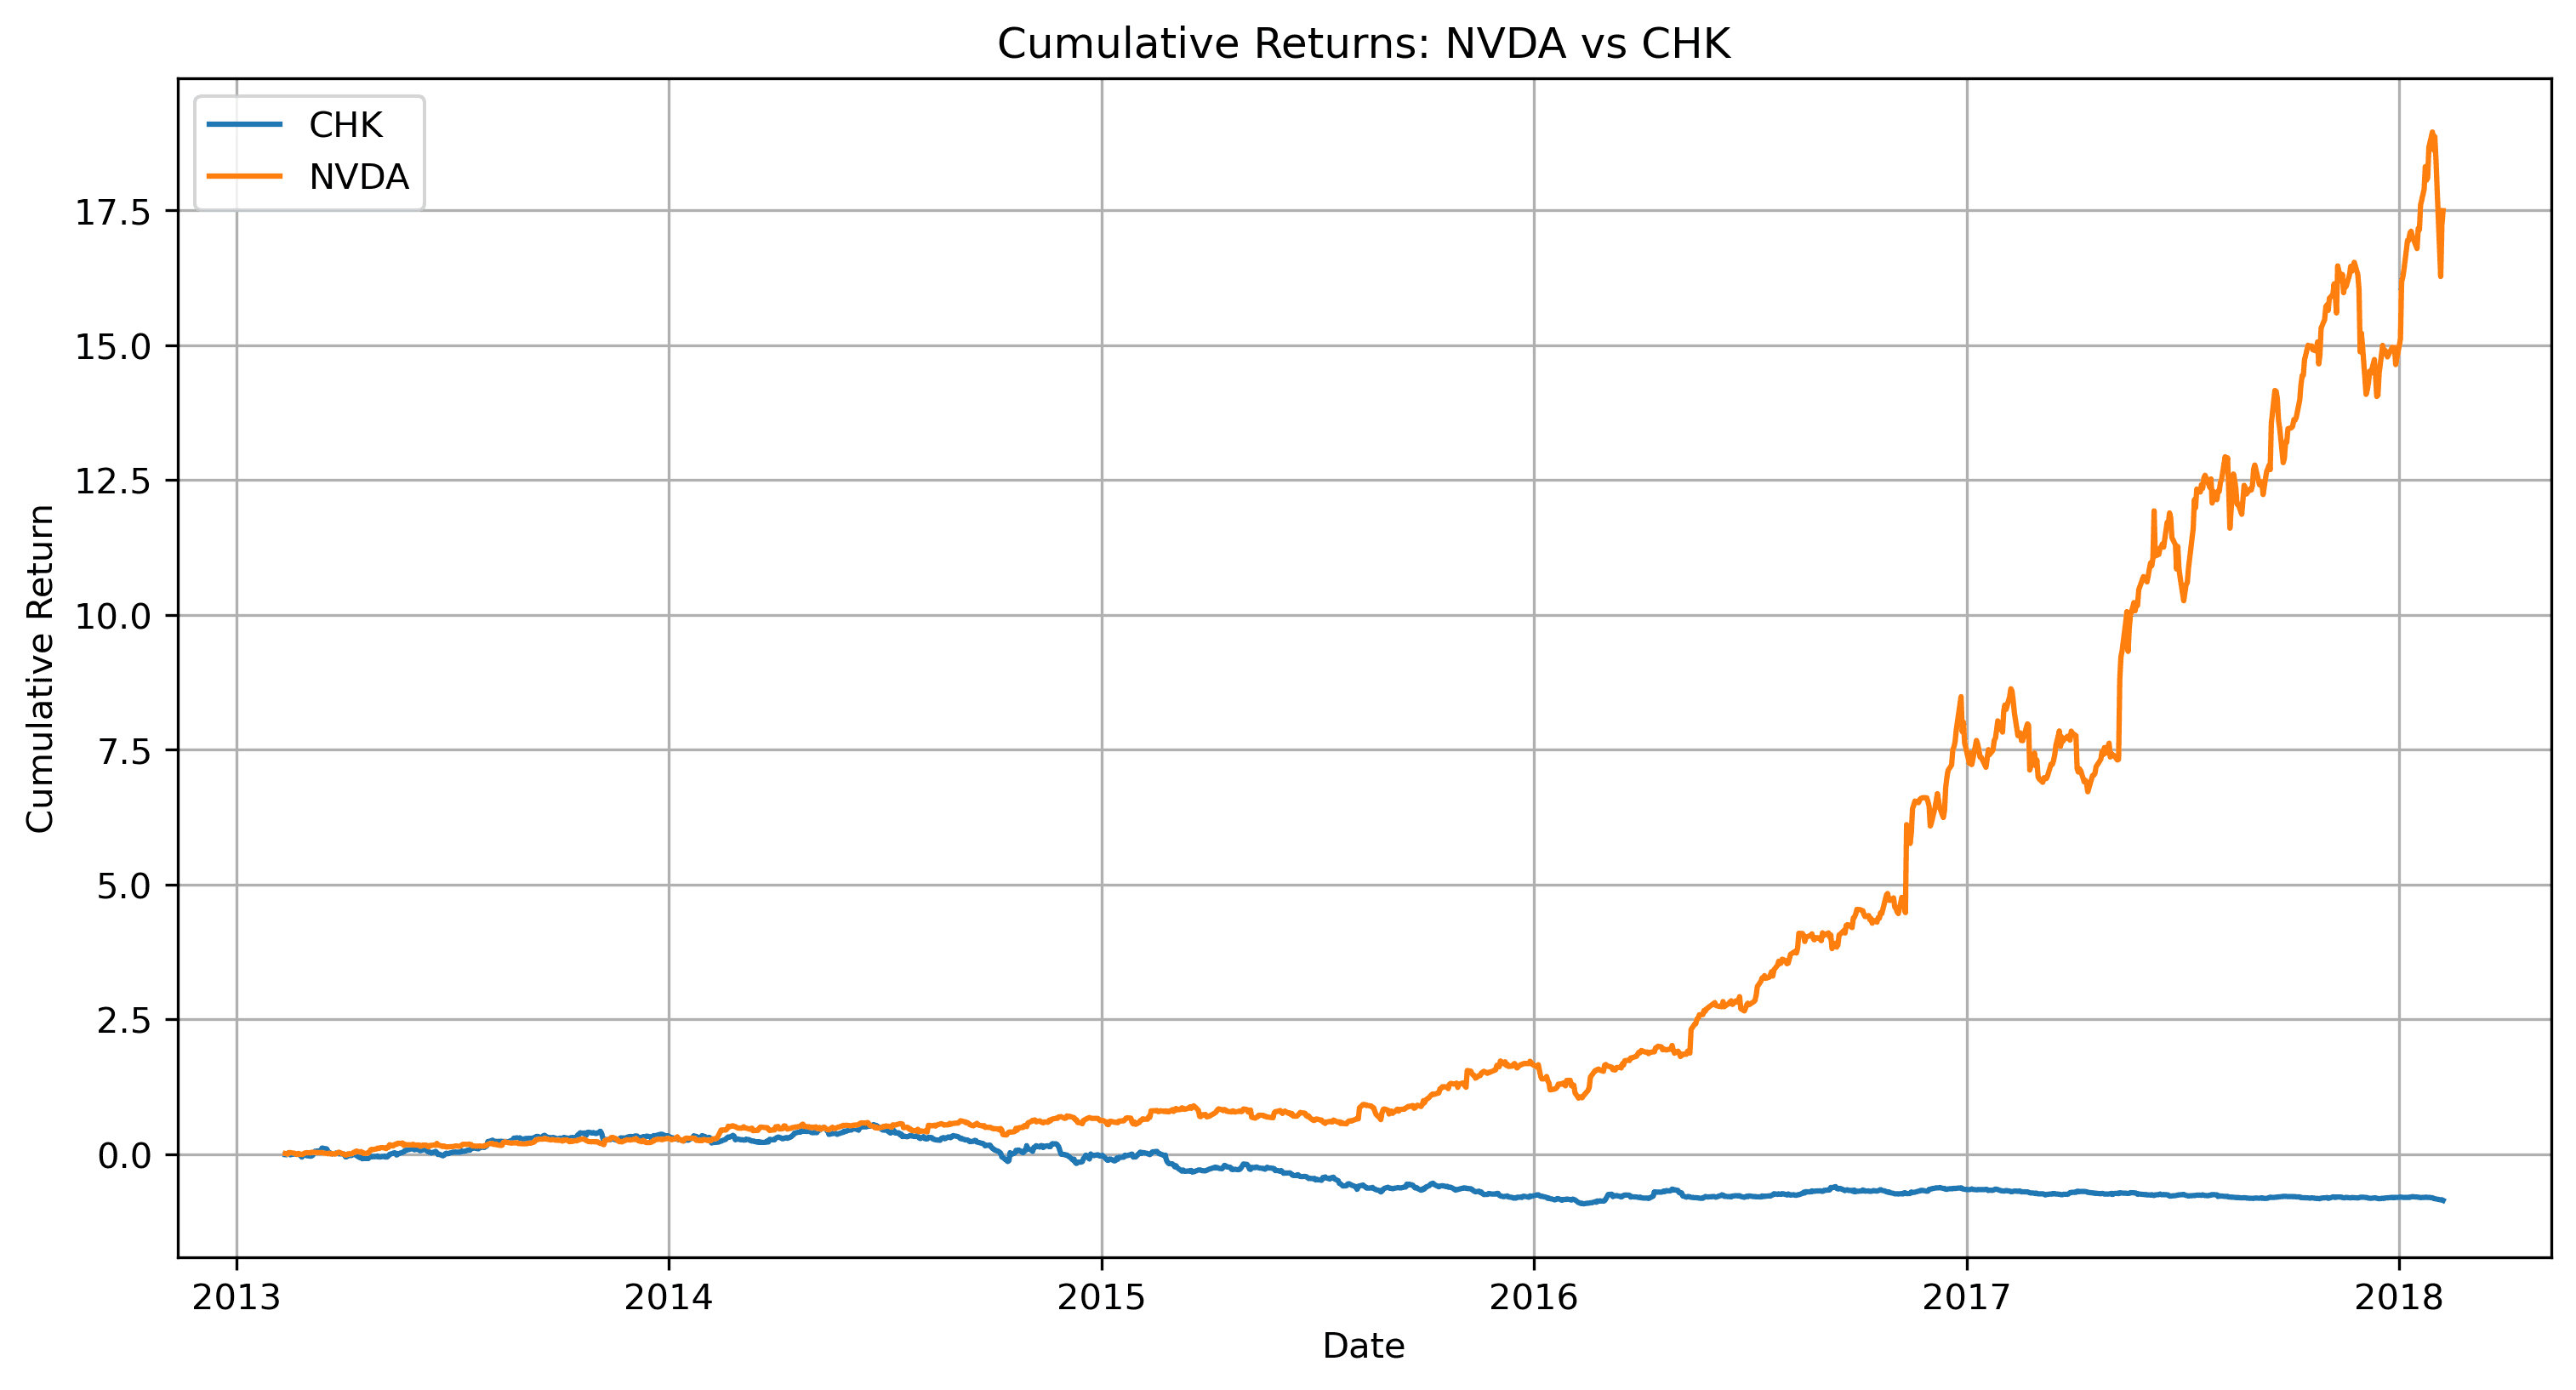
NVDA vs CHK — Cumulative Returns
High return vs. high volatility: NVDA’s exponential lift compared to CHK’s flat, volatile path.
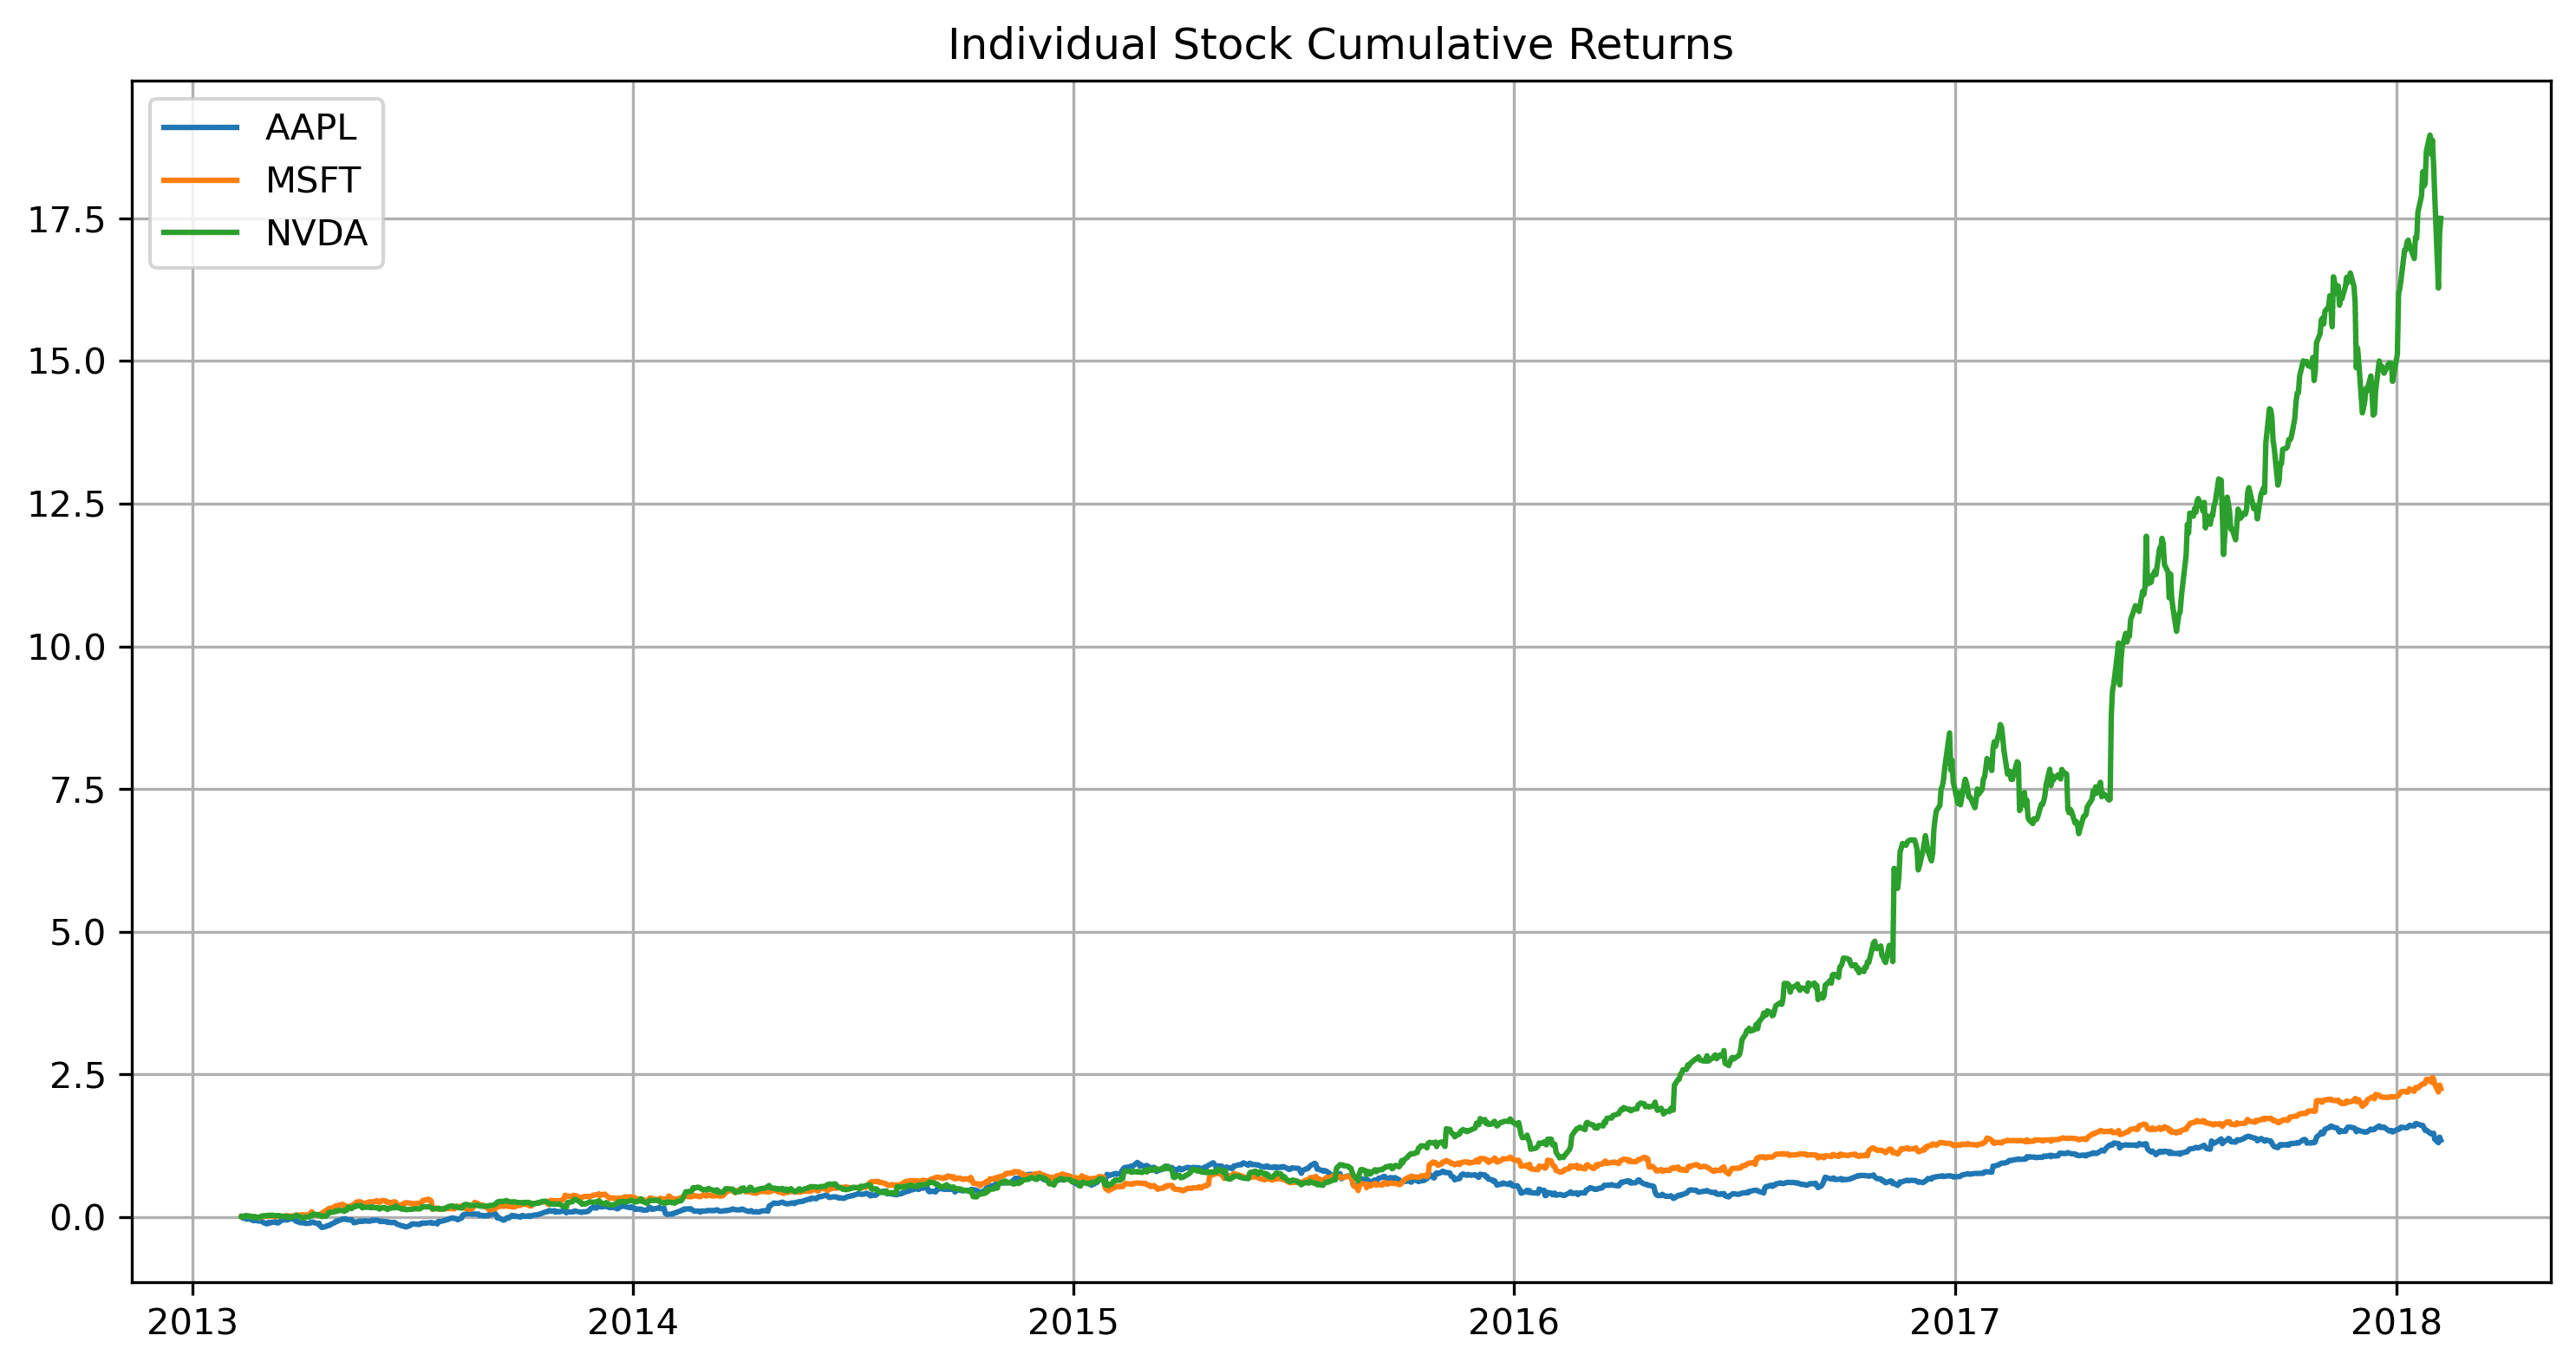
Individual Stock Cumulative Returns
AAPL and MSFT provide steady climbs; NVDA inflects sharply post-2016.
Portfolio Performance Over Time
Diversified portfolio curve with steady growth and moderated drawdowns.
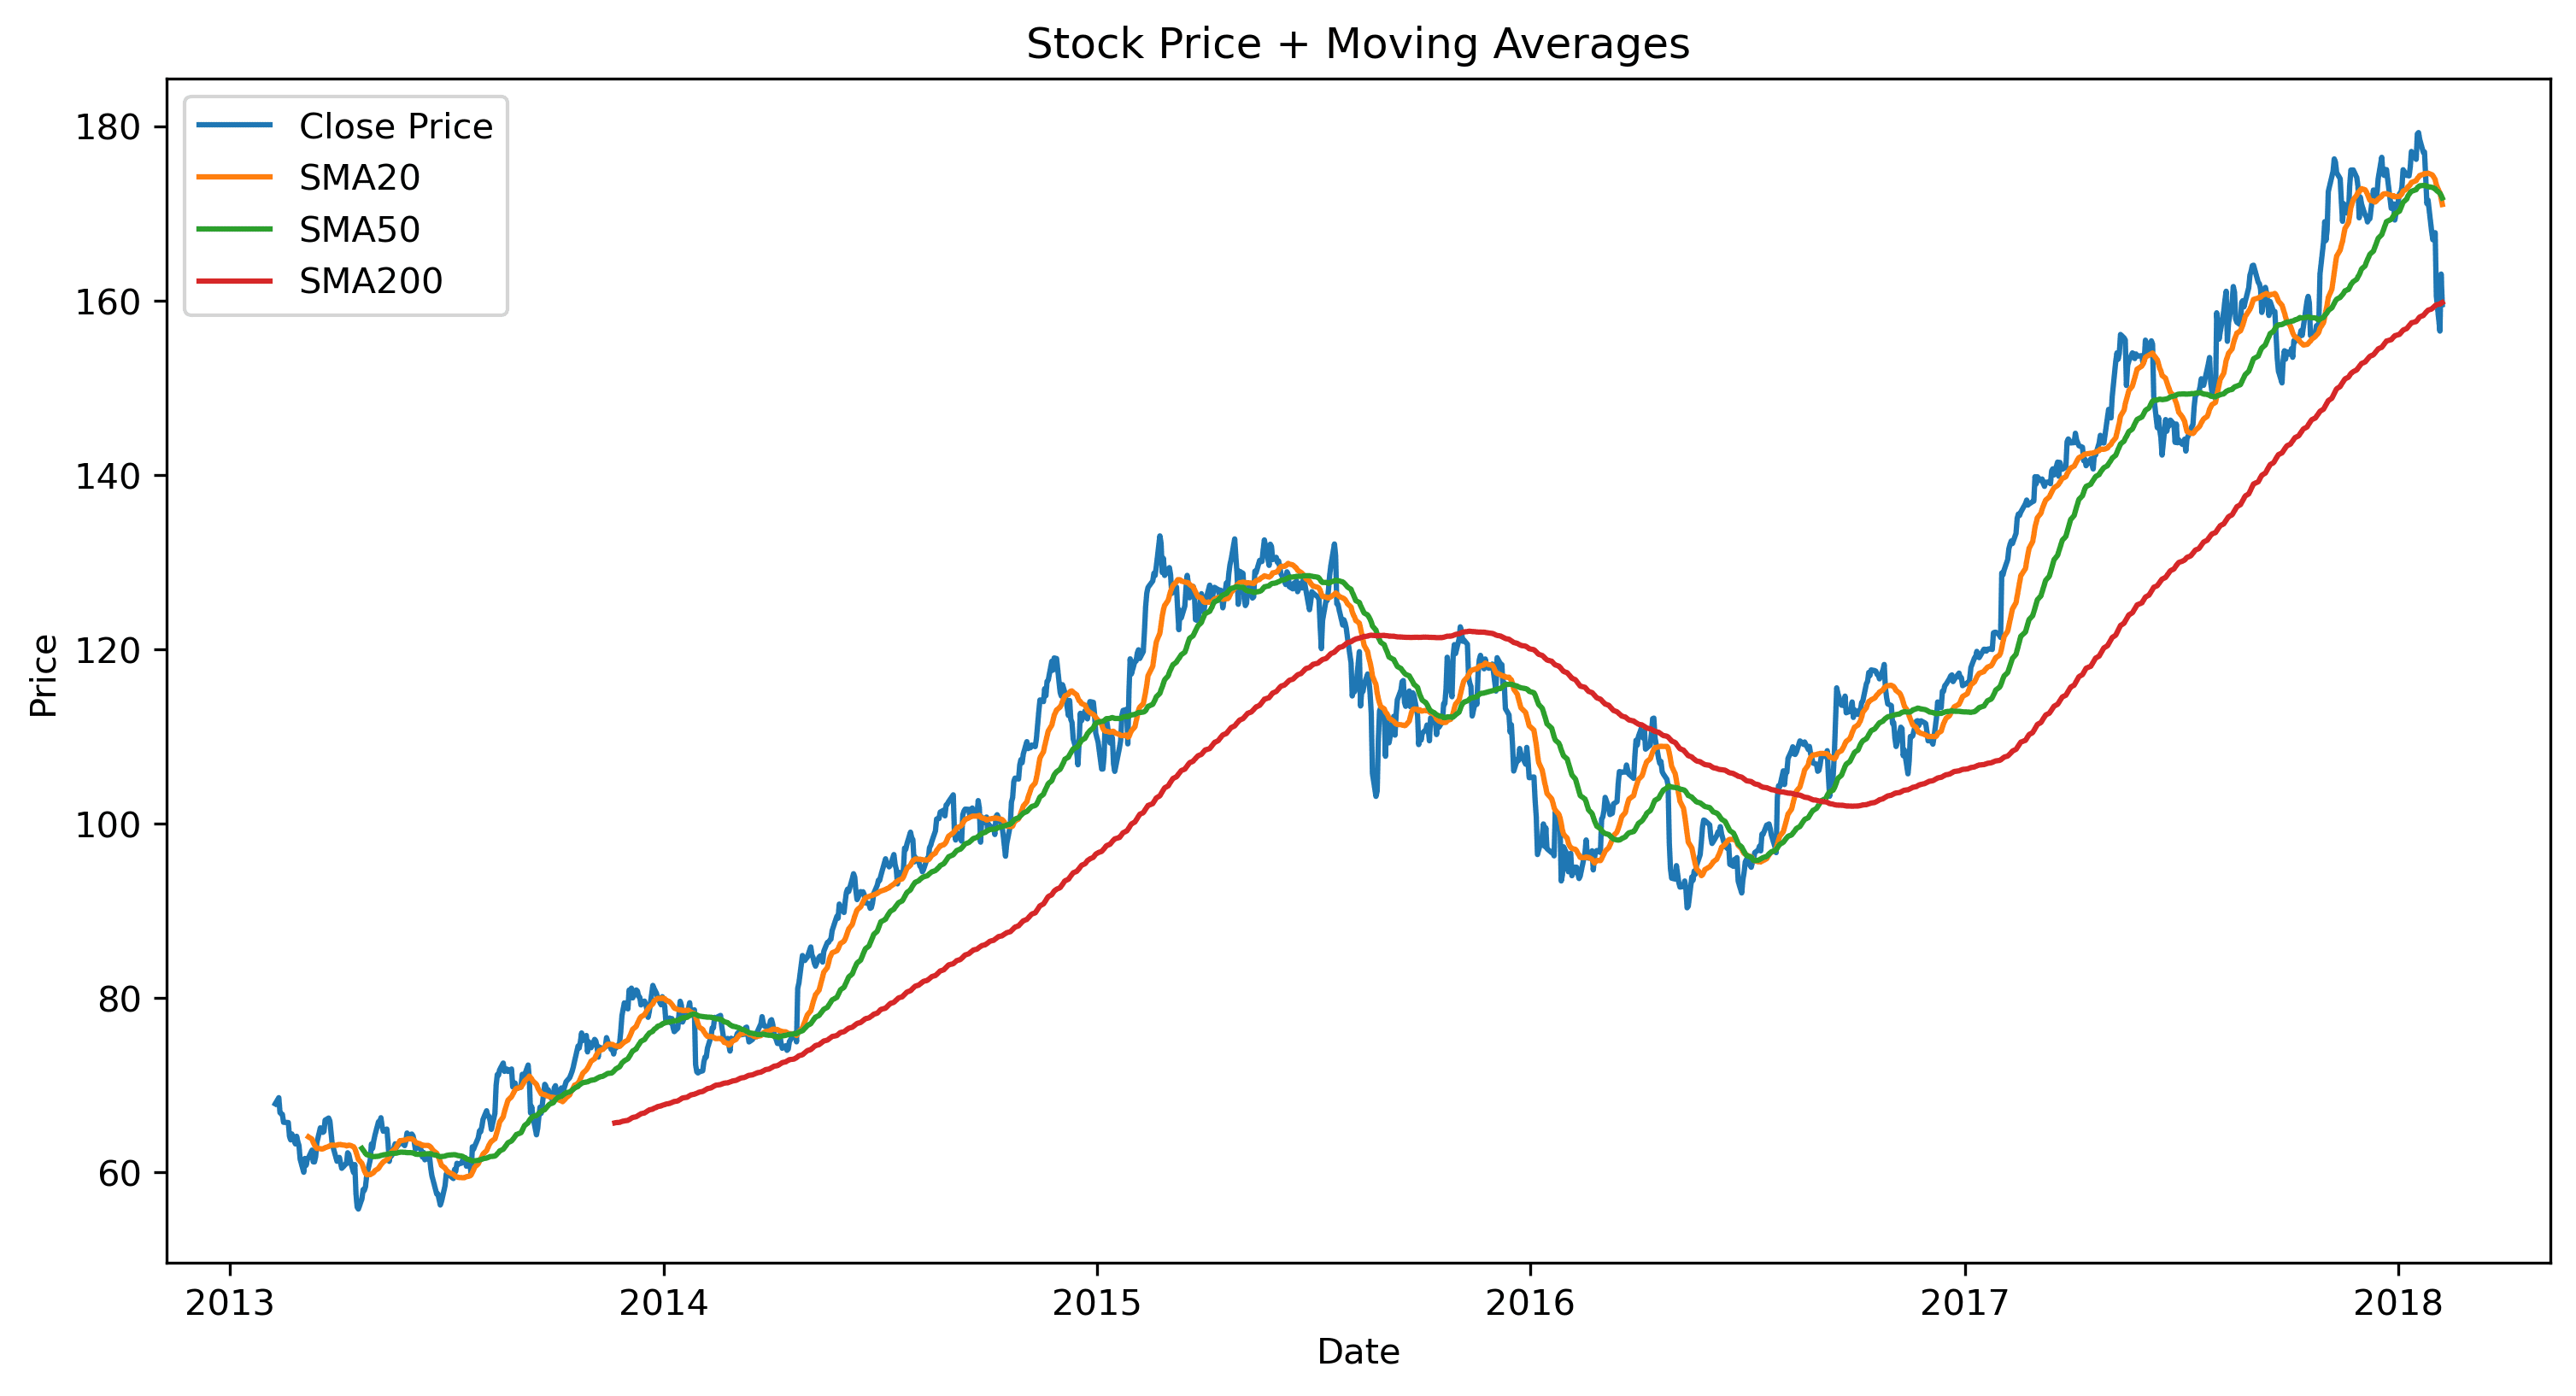
Stock Price + Moving Averages
SMA20/50/200 trend-following view showing momentum shifts and long-term uptrend.
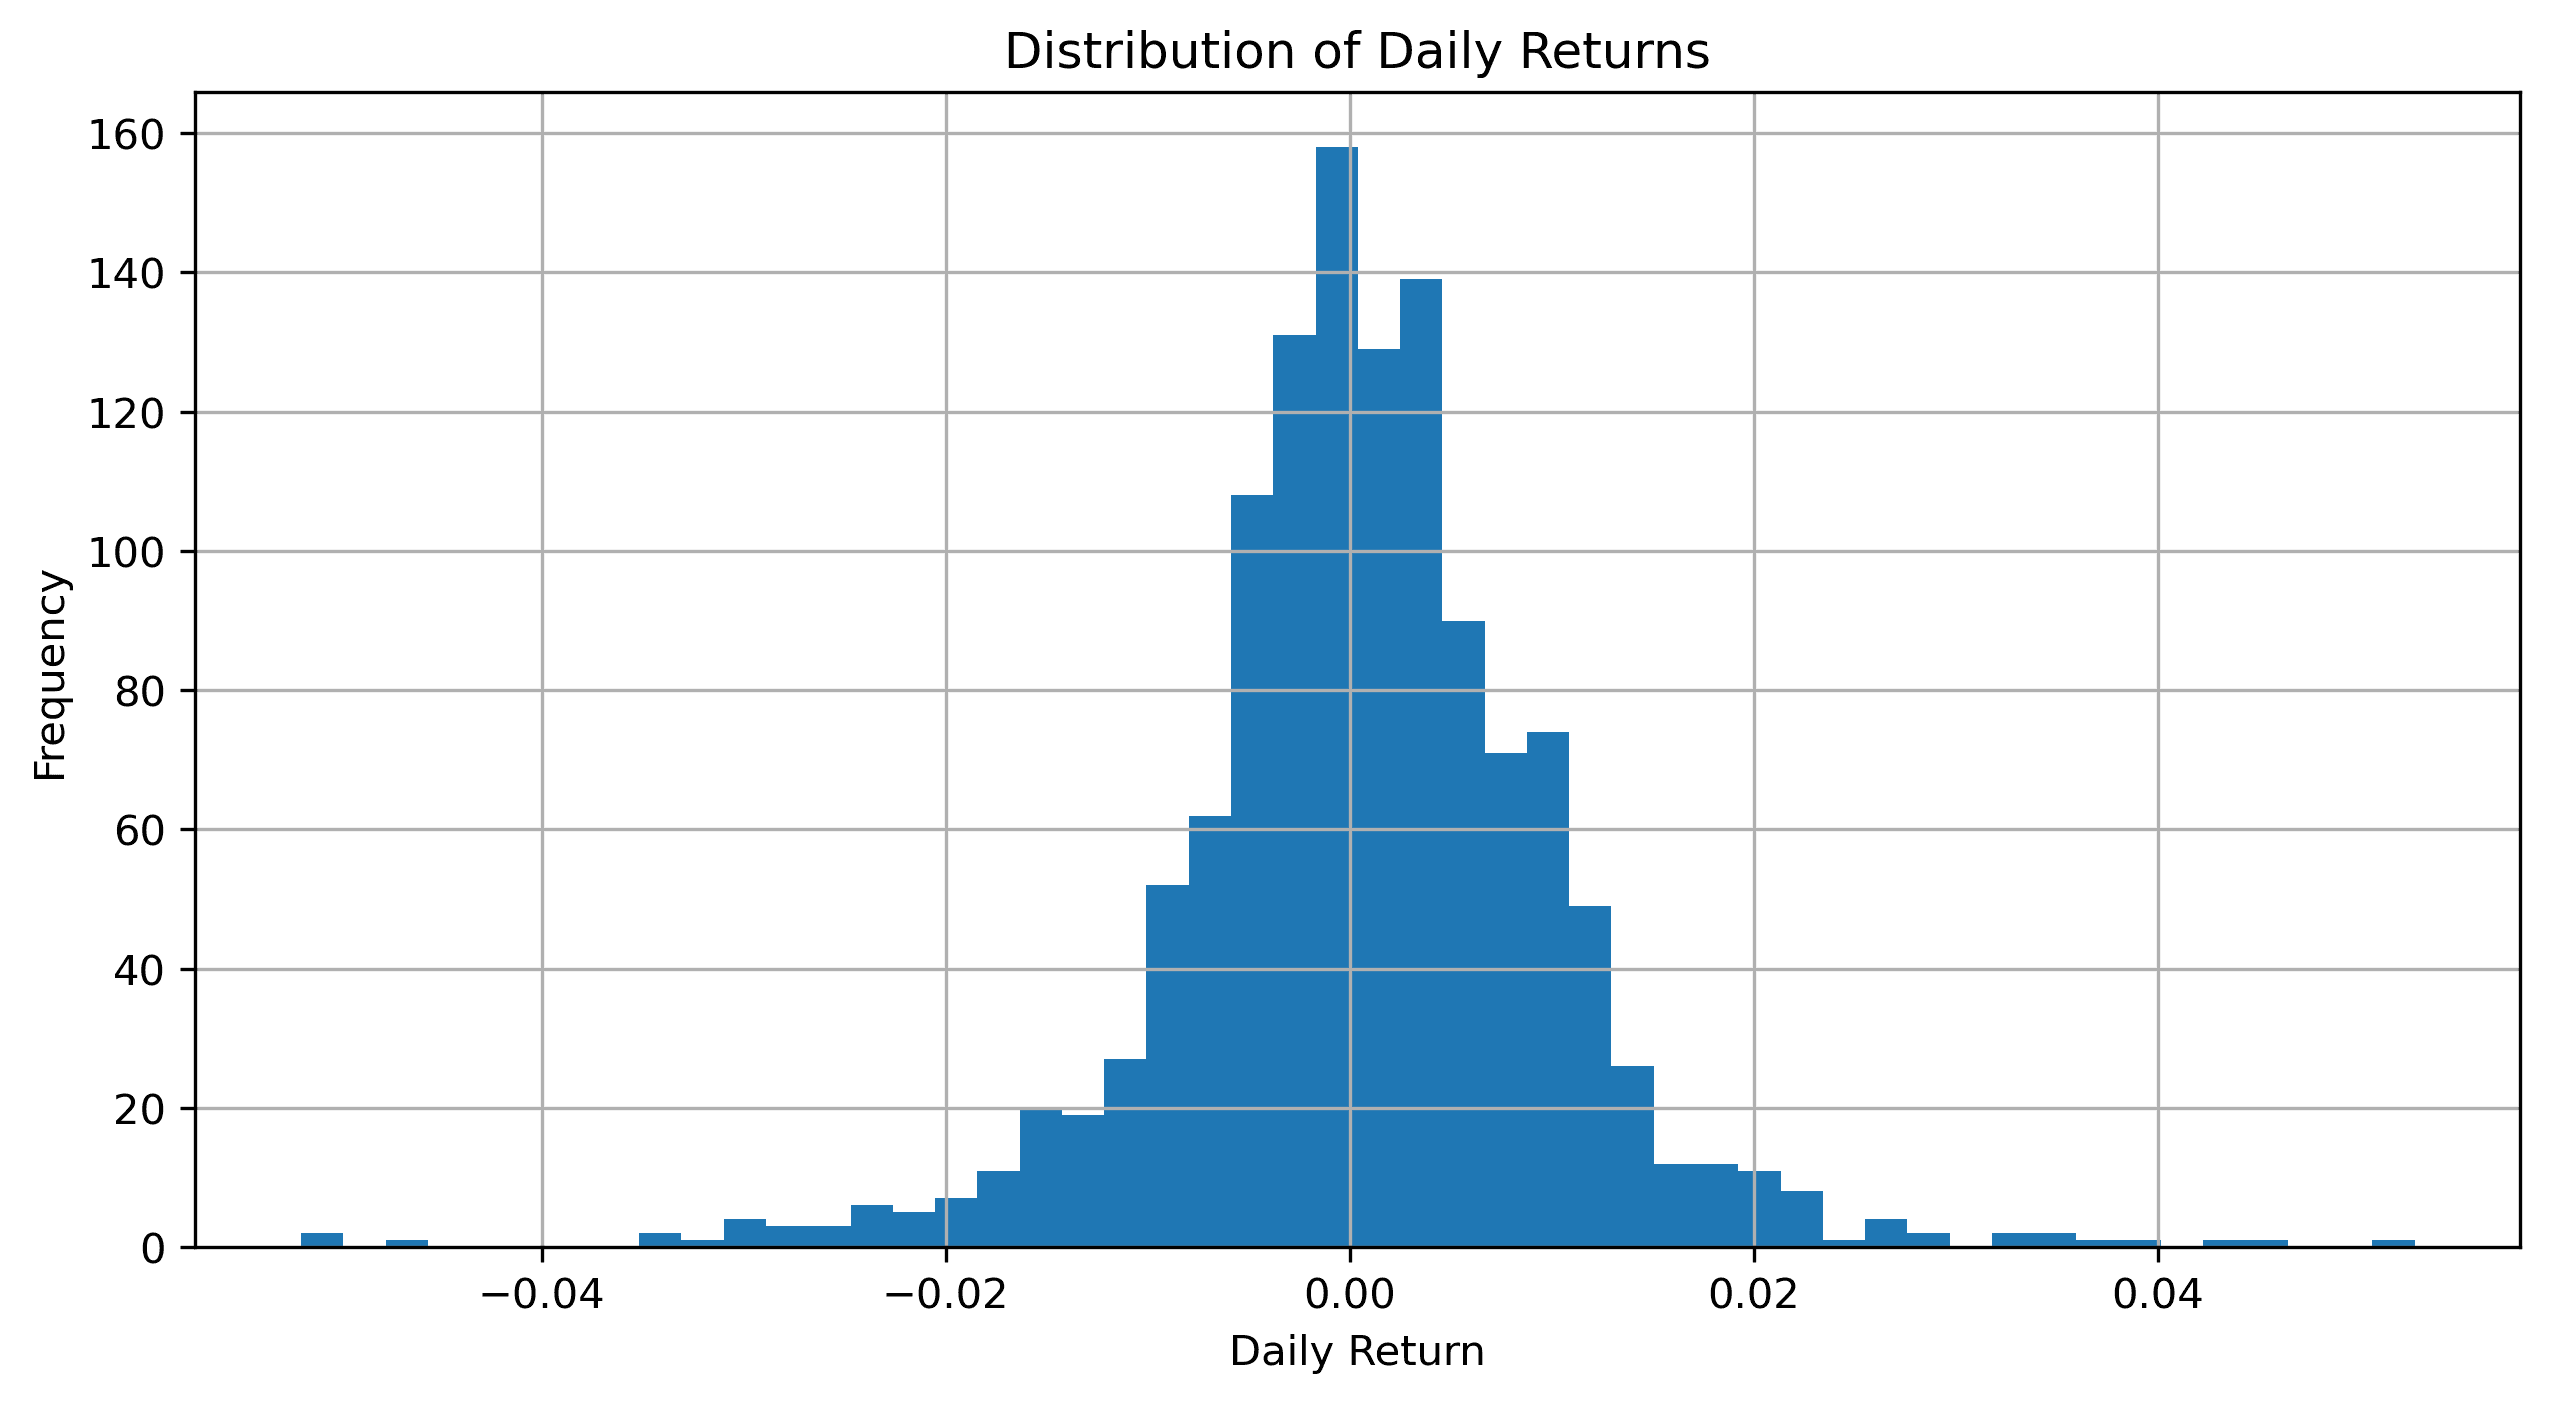
Distribution of Daily Returns
Most days cluster near 0% with occasional tails—useful for risk context.
Next step
Want this kind of analysis on your portfolio?